This plugin helps you visualize data in TWiki tables as charts, using a default linear scale or an optional semi-logarithmic scale.
variable gets expanded to an image representing the chart. Parameters and global settings determine the type of chart, dimensions, and values.
Plugin settings are stored as preferences variables. Do not change the settings here, overload them in
. To overload a plugin setting, prefix it with
. For example, to overload the
bullet in Main.TWikiPreferences.
variable gets expanded to an image representing the chart.
| %CHART% Parameter |
Comment |
Default |
type |
The type of chart to create. One of "area", "bar", "line", "scatter", "combo", "sparkline", "sparkbar", or "sparkarea" |
Global TYPE setting |
subtype and subtype2 |
Sub type of selected data. subtype applies to data while subtype2 applies to data2. Supported values depend on chart type: |
|
- for type="area": subtype="area" |
"area" |
- for type="bar": subtype="bar" |
"bar" |
- for type="line": subtype="line, point, pline" (point line) |
"line" |
- for type="scatter": subtype="area, bar, line, point, pline"
Note: you cannot mix area and bar on the same chart.
Note: It is not recommended using showing a bar on a scatter chart as the X axis placement is skewed with bar and will not exactly line up with drawn X axis values which will defeat the purpose of using scatter in the first place. |
"point" |
- for type="combo": subtype="area, bar, line, point, pline" (note: you can not mix area and bar on the same chart) |
All but the last data set are drawn as "area" and the last is drawn as "line" |
You can use a comma delimited list of values to set a specific subtype for each data set. For example "area, area, point, line" would say that the first two data sets are areas, the third is point and the last one is a line |
|
scale |
The scale to use when creating the chart. "linear" or "semilog" |
Global SCALE setting |
name |
Name to uniquely identify the chart file that is auto-created. |
None; is required for all charts |
web |
The web in which to find topic (specified below) in which to find the TWiki tables |
The current web |
topic |
The topic in which to find the TWiki tables |
The current topic |
table |
TWiki table used to build the chart. A numerical value refers to the table number, where "1" is the first table seen in a topic. Any other non-numeric string refers to a named table defined by the TABLE variable with a name parameter. For example, table="trends" refers to the table that is preceded by %TABLE{ name="trends" }%. |
"1" |
title |
The title placed at the top of the chart |
None |
xlabel |
The label placed under the X axis describing the X values |
None |
ylabel and ylabel2 |
The label placed to the left of the left Y axis (ylabel) or right of the right Y axis (ylabel2) describing the Y values |
None |
data and data2 |
The source data displayed on the chart. Values specified with data are displayed relative to the left Y axis while values specified with data2 are displayed relative to the right Y axis. In both cases, they define either a range of table cells or explicit data values. For example for type="line", a data="R2:C3..R999:C6" would say that four lines were to be drawn with the first line being rows 2-999 column 3 and last line being rows 2-999 column 6. In the case of a scatter graph, data represents the actual Y values. Note: Reversed data is allowed so data="R999:C6..R2:C3" is a legal data specification. Explicit data is also allowed so data="R999:C6..R2:C3,0" would draw 5 lines, the first 4 coming from the table and the 5th having a constant value of 0. |
None; is required for all charts |
defaultdata |
If there is sparse data, then use the value specified by defaultdata to fill in the missing data. A value of "none" means only draw actual data points. |
Global DEFAULTDATA setting |
xaxis |
X-Axis labels: The values are defined as a range of table cells. In case of scatter graph, xaxis represents the actual X values. The range also defines the orientation -- row or column oriented (if specified). For example "R2:C2..R999:C2" would take all of column 2 starting at row 2 and going through row 999. It would also denote that all remaining data is oriented columnar. |
None. Is required for type="scatter". If not specified, then no X axis labels shown and data assumed to be in columnar format. |
xaxisangle |
Angle the X-Axis labels are drawn. Only two angles are supported at this time, "0" draws horizontal labels, other numbers draw vertical labels |
"0" |
yaxis and yaxis2 |
Y-Axis labels for the left Y axis and the right Y axis: "on" to show the labels, "off" for no labels. |
"off" |
xmin |
Minimum value drawn on the X axis. Note: this is only applicable for scatter charts. |
The minimum value specified by xaxis |
xmax |
Maximum value drawn on the X axis. Note: this is only applicable for scatter charts. |
The maximum value specified by xaxis |
ymin and ymin2 |
Minimum value drawn on the left (ymin) and right (ymin2) Y axis |
The minimum value specified by data and data2 |
ymax and ymax2 |
Maximum value drawn on the left (ymax) and right (ymax2) Y axis |
The maximum value specified by data and data2 |
xgrid |
Grid shown for X axis: "on" for solid grid lines, "dot" for dotted grid lines, "off" for none. |
"dot" |
ygrid |
Grid shown for Y axis: "on" for solid grid lines, "dot" for dotted grid lines, "off" for none. |
"dot" |
numygrids |
Number of Y axis grids drawn |
Global NUMYGRIDS setting |
ytics and ytics2 |
Number of tic marks to draw between Y axis grid lines for the left (ytics) and right (ytics2) Y axis. |
If scale="semilog", then ytics="10", else defaults to "0" |
numxgrids |
Number of X axis grids drawn. This can be used if there are a large number of X axis data points such that the X axis labels overlap. |
Draw all X-Axis labels |
datalabel and datalabel2 |
Shows data value labels above drawn data points for data and data2 data. Possible values are: "off" | Do not show any data value labels | "on" | Show the data value labels for all data points | "box" | Show the data value labels inside of a box for all data points | "auto" | Show the data value labels for only data points falling on an X-axis grid line. This option should be used when there are a lot of data points and the data values start to be drawn on top of each other making them impossible to read. | | "autobox" or
"auto box" or
"boxauto" or
"box auto" | Show the data value labels inside of a box for only data points falling on an X-axis grid line. This option should be used when there are a lot of data points and the data values start to be drawn on top of each other making them impossible to read. | "##"
(an integer number) | Show the first and last data value labels along with trying to show (## - 2) additional data value labels in between. An even distribution of data value labels will be shown so it is possible that fewer data value labels than requested will be displayed. For example with 16 data values charted, requesting "7", "8", or "9" data value labels would only show a total of 8. | | "##box" or
"## box" or
"box##" or
"box ##" | Show the first and last data value labels inside of a box along with trying to show (## - 2) additional data value labels (in boxes) in between. An even distribution of data value labels will be shown so it is possible that fewer data value labels than requested will be displayed. For example with 16 data values charted, requesting "7", "8", or "9" data value labels would only show a total of 8. |
|
"off" |
legend |
Legend shown to the right of the chart. For example "R1:C3..R1:C6" would take all of row 1 starting at column 3 and going through column 6 as the name/legend of each set of data points |
None; no legend if not specified |
width |
Defines the overall width of the chart in pixels.
Note: if type="sparkbar" and width="0", then the width will be auto computed to be the minimum width to allow easily readable spark bars. |
Global WIDTH setting |
height |
Defines the overall height of the chart in pixels. |
Global HEIGHT setting |
alt |
Alternate text for chart image |
Empty alt tag |
colors and colors2 |
A list of colors defining the color of each set of data points for data and data2. Color values are of the form: Hexadecimal RGB color "#ffffff" or "transparent" |
Global LINE_COLORS setting for lines; global AREA_COLORS setting for area |
bgcolor |
Background color of the area surrounding/outside the chart, the area inside the chart, and the data label boxes. Color values are of the form: Hexadecimal RGB color "#ffffff" or "transparent". For example, "#e7e7e7" sets a light gray background (outside the chart) color. Optionally specify a second values for the chart background itself (the inside color) and an optional third value which is the value of the color to fill data label boxes with. For example, "#e7e7e7, #ffffc0" defines a chart with a light yellow inside background on a light gray outside, with default data label box background color. |
Global BGCOLOR setting |
gridcolor |
Colors/style of the grid (if any). If xgrid="on" or ygrid="on" then use the first gridcolor for drawing solid grid lines. If xgrid="dot" or ygrid="dot", then use the full set of colors to define the line style for drawing the grid lines. "transparent" can be used to introduce holes in the line." |
Global GRIDCOLOR setting |
linewidth |
Width of data lines in pixel |
Global LINEWIDTH setting |
pointsize |
Size of data points in pixel |
Global POINTSIZE setting |
showerror |
Specify how any error messages are handled. Possible values are:
-
"text" -- all error messages are produced as regular (red) text -
"image" -- all error message are placed inside of an image sized according to the size of the chart if there were no error. -
"none" or "no" -- no error messages are produced. HTML text of is returned
|
Global SHOWERROR setting |
errmsg_nodata and errmsg_nodata2 |
errmsg_nodata: Specify a custom error message when no data is available. errmsg_nodata2: Specify a custom error message when no data in data2 is available.
These are useful when this plugin is charting data from %DBI_QUERY% and no data is returned from this query and you want your own custom error message instead of the generic plugin error message. |
Default plugin error message. |
| (other parameters) |
Other parameters are passed on to the img tag. Useful to add additional image parameters like align="right" |
None |
.
Assuming the following three TWiki tables. The first shows the data oriented in columns while the seconds shows the data oriented in rows
| Type of chart |
You type |
You should get... |
...if installed |
| area |
Multiple areas
%CHART{name="area1" table="exampleTable2" type="area" data="R2:C2..R99:C6" xaxis="R1:C2..R1:C99" legend="R2:C1..R99:C1" ymax="30" width="225" height="200" numygrid="4"}% |
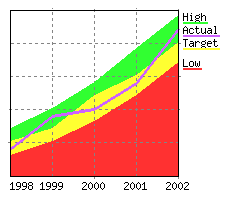 |
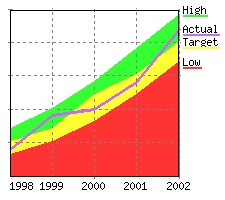 |
| bar |
Multiple bars
%CHART{name="bar1" table="exampleTable2" type="bar" data="R3:C2..R99:C4" xaxis="R1:C2..R1:C4" legend="R3:C1..R99:C1" ymin="0" ymax="19" numygrids="9" width="225" height="200"}% |
 |
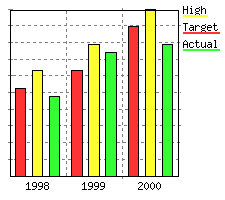 |
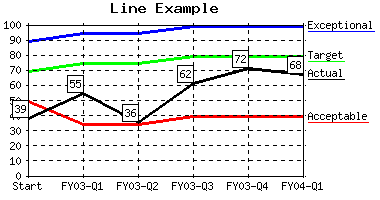
| line |
Simple line
%CHART{name="line1" table="exampleTable1" type="line" data="R2:C2..R6:C2" xaxis="R2:C1..R6:C1" legend="R1:C2..R1:C2" ymin="5" ymax="40" numygrids="6" width="225" height="200"}% |
 |
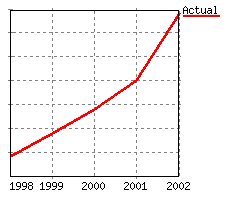 |
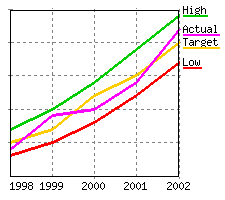
| line |
Multiple lines
%CHART{name="line2" table="exampleTable2" type="line" data="R2:C2..R5:C6" xaxis="R1:C2..R1:C6" legend="R2:C1..R5:C1" ymin="5" ymax="30" numygrids="4" width="225" height="200"}% |
 |
 |
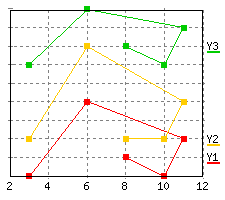
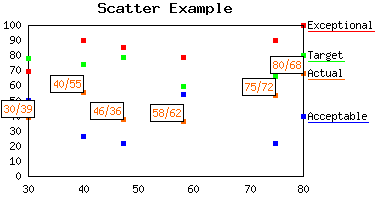
| scatter |
Multiple scatter
%CHART{name="scatter1" table="exampleTable3" type="scatter" subtype="pline" data="R2:C2..R6:C4" xaxis="R2:C1..R6:C1" legend="R1:C2..R1:C4" ymin="1" ymax="10" xmax="12" numygrids="8" numxgrids="8" linewidth="1" width="225" height="200"}% |
 |
 |
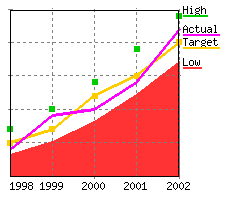
| combo |
Combo with area, pline, point, & line
%CHART{name="combo1" table="exampleTable2" type="combo" subtype="area, pline, point, line" data="R2:C2..R5:C6" xaxis="R1:C2..R1:C6" legend="R2:C1..R5:C1" ymin="5" ymax="30" numygrids="4" numxgrids="4" width="225" height="200"}% |
 |
 |
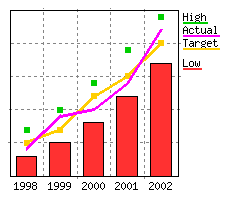
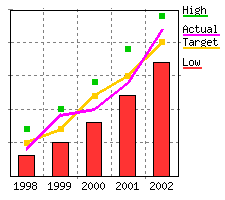
| combo |
Combo with bar, pline, point, & line
%CHART{name="combo2" table="exampleTable2" type="combo" subtype="bar, pline, point, line" data="R2:C2..R5:C6" xaxis="R1:C2..R1:C6" legend="R2:C1..R5:C1" ymin="5" ymax="30" numygrids="4" numxgrids="4" width="225" height="200"}% |
 |
 |
| sparkline |
sparkline
%CHART{name="sparkline" type="sparkline" data="88, 84, 82, 92, 82, 86, 66, 82, 44, 64, 66, 88, 96, 80, 24, 26, 14, 0, 0, 26, 8, 6, 6, 24, 52, 66, 36, 6, 10, 14, 30" width="75" height="16" colors='#224262' bgcolor='transparent'}% |
 |
 |
| sparkbar |
sparkbar
%CHART{name="sparkbar1" type="sparkbar" data="88, 84, 82, 92, 82, 86, 66, 82, 44, 64, 66, 88, 96, 80, 24, 26, 14, 0, 0, 26, 8, 6, 6, 24, 52, 66, 36, 6, 10, 14, 30" width="75" height="16" colors='#224262' bgcolor='transparent'}% |
 |
 |
| sparkbar |
sparkbar (width="0" so the width will be auto sized)
%CHART{name="sparkbar2" type="sparkbar" data="88, 84, 82, 92, 82, 86, 66, 82, 44, 64, 66, 88, 96, 80, 24, 26, 14, 0, 0, 26, 8, 6, 6, 24, 52, 66, 36, 6, 10, 14, 30" width="0" height="16" colors='#224262' bgcolor='transparent'}% |
 |
 |
| sparkarea |
sparkarea
%CHART{name="sparkarea" type="sparkarea" data="88, 84, 82, 92, 82, 86, 66, 82, 44, 64, 66, 88, 96, 80, 24, 26, 14, 0, 0, 26, 8, 6, 6, 24, 52, 66, 36, 6, 10, 14, 30" width="75" height="16" colors='#224262' bgcolor='transparent'}% |
 |
 |
The "if installed" column shows images instead of variables in case the plugin is installed correctly.
Charts can be created dynamically based on TWiki tables with SEARCH and CALC.
, then visualize it with a CHART. If the number of rows in a table is not known, specify a big row number in the CHART, such as
. The ChartPlugin is smart enough to use the actual number of rows.
formulas. Here is an example table that sums up the total in the right hand column:
a topic that has a CHART pointing to a table with CALCs. By default, the
delays CALCs in included topics and evaluates them once all INCLUDEs are processed. With that, the CHART in an included topic sees unprocessed CALCs, resulting in a chart with incorrect values. To get he desired result you need to set the following preference setting in the topic that
This setting tells the SpreadSheetPlugin to process the CALCs in the included page, e.g. it will not delay the evaluation of the formulas.
If the required parameters are not defined, then an error message is returned or an <img ... /> image tag is returned pointing to a graphic containing the error message.



 that are part of the flow of a sentence or paragraph.
  sparkline in the shape of small bars.
  sparkline in the shape of an area.


 on TWiki.org for more information.


